A-FrameA web framework for building virtual reality experiences

Make WebVR with HTML and Entity-Component
Works on Vive, Rift, Daydream, GearVR, desktop
amChartsJavaScript Charts & Maps
Easily add charting capabilities to your websites and applications. Compatible with all modern and most legacy browsers (yes even IE7), JavaScript Charts allows creating flexible Pie, Column, Line, and number of other chart types.
Chart.jsSimple yet flexible JavaScript charting for designers & developers

Chart.js _ Open source HTML5 Charts for your website
D3Data-Driven Documents
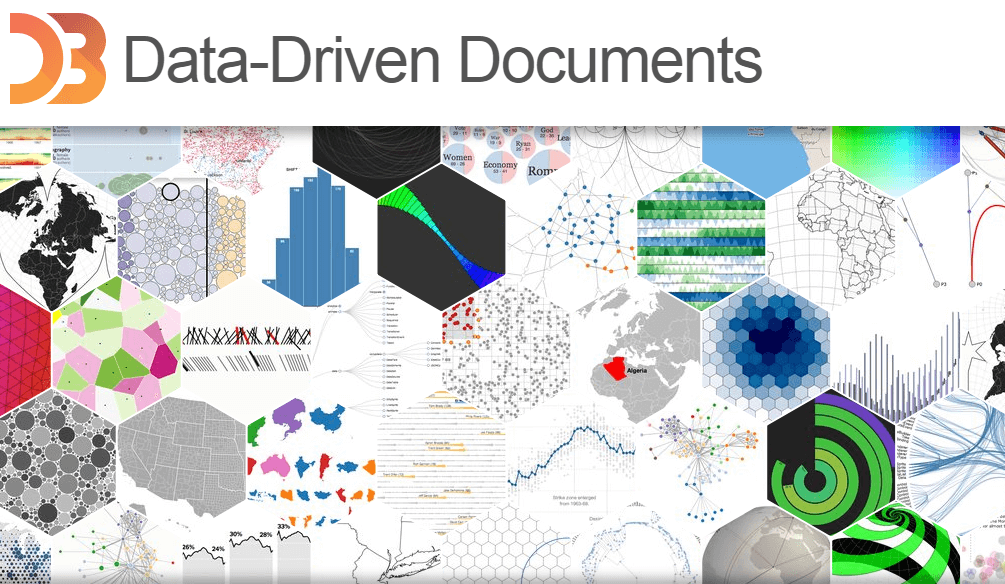
D3.js is a JavaScript library for manipulating documents based on data. D3 helps you bring data to life using HTML, SVG, and CSS. D3’s emphasis on web standards gives you the full capabilities of modern browsers without tying yourself to a proprietary framework, combining powerful visualization components and a data-driven approach to DOM manipulation.
ExhibitPublishing Framework for Data-Rich Interactive Web Pages
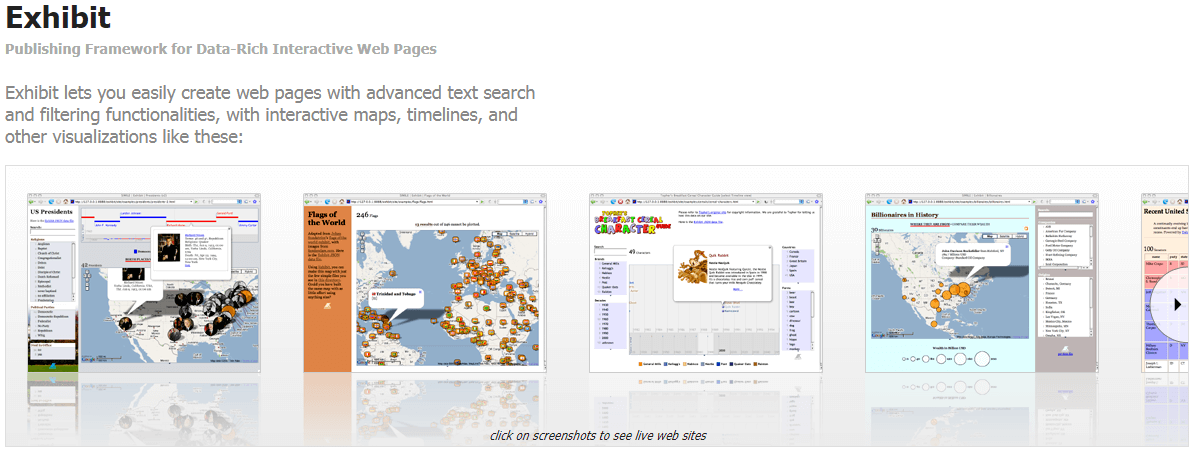
Exhibit lets you easily create web pages with advanced text search and filtering functionalities, with interactive maps, timelines, and other visualizations like these.
Google ChartsDisplay live data on your site.

Google chart tools are powerful, simple to use, and free. Try out our rich gallery of interactive charts and data tools
HighchartsMake your data come alive
Highcharts makes it easy for developers to set up interactive charts in their web pages.
HighstockHIGH-PERFORMANCE
FINANCIAL CHARTING LIBRARY.
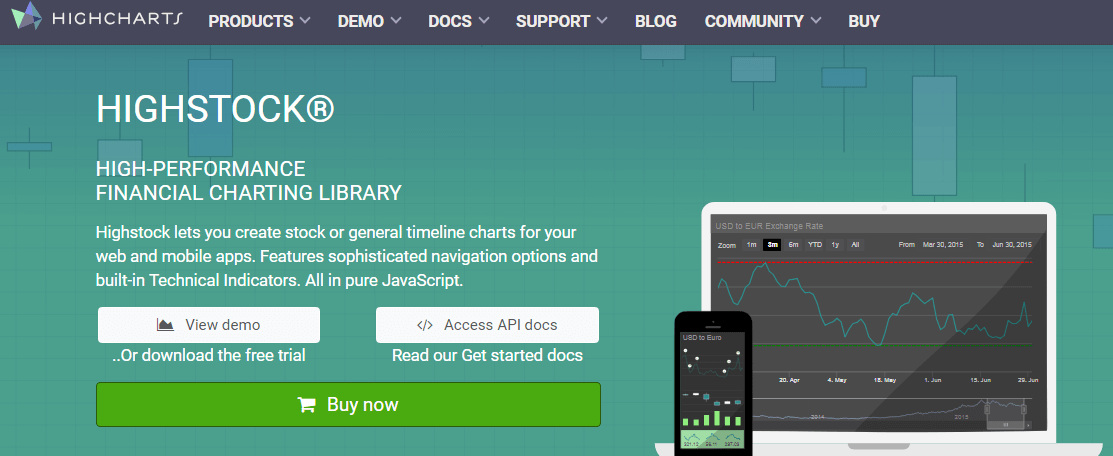
Highstock lets you create stock or general timeline charts for your web and mobile apps. Features sophisticated navigation options and built-in Technical Indicators. All in pure JavaScript.
JavaScript Infovis ToolkitCreate Interactive Data Visualizations for the Web.
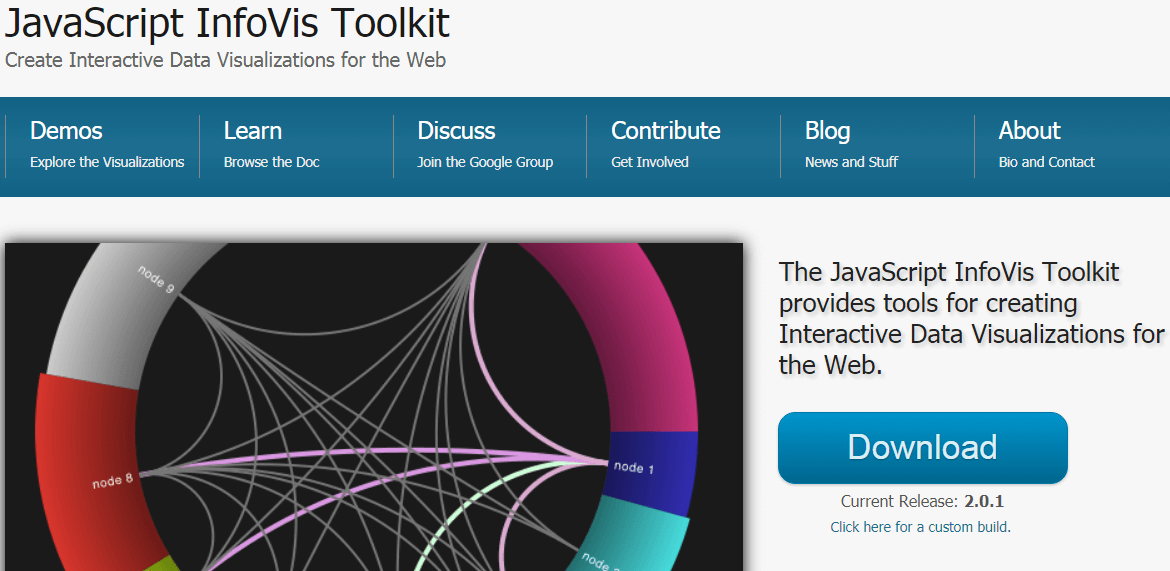
The JavaScript InfoVis Toolkit provides tools for creating Interactive Data Visualizations for the Web.
jqPlotA Versatile and Expandable jQuery Plotting Plugin!
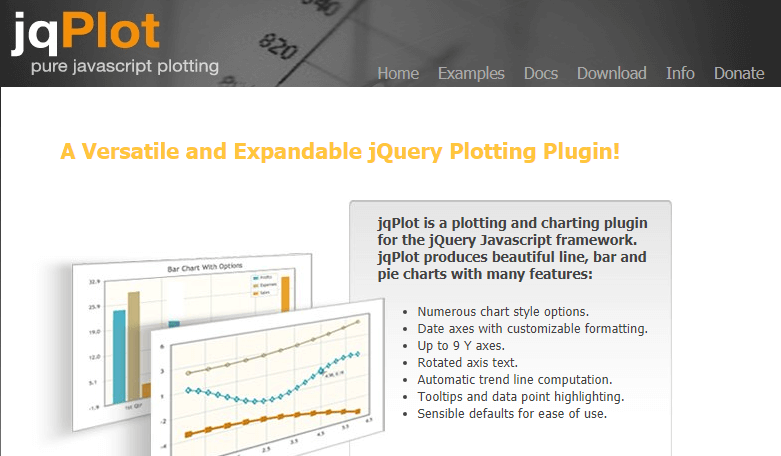
Computation and drawing of lines, axes, shadows even the grid itself is handled by pluggable “renderers”. Not only are the plot elements customizable, plugins can expand functionality of the plot too! There are plenty of hooks into the core jqPlot code allowing for custom event handlers, creation of new plot types, adding canvases to the plot, and more!
jQuery SparklinesjQuery Sparklines
This jQuery plugin generates sparklines (small inline charts) directly in the browser using data supplied either inline in the HTML, or via javascript.
JS ChartsJavaScript charts.
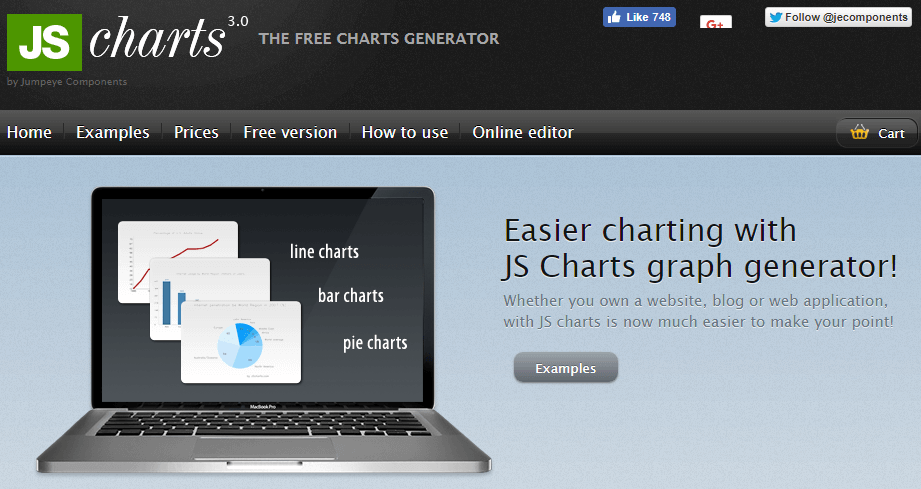
JS Charts is a JavaScript based chart generator that requires little or no coding. With JS Charts drawing charts is a simple and easy task, since you only have to use client-side scripting (i.e. performed by your web browser). No additional plugins or server modules are required. Just include our scripts, prepare your chart data in XML, JSON or JavaScript Array and your chart is ready!
KibanaYour Window into the Elastic Stack.
Kibana lets you visualize your Elasticsearch data and navigate the Elastic Stack, so you can do anything from learning why you’re getting paged at 2:00 a.m. to understanding the impact rain might have on your quarterly numbers.
KineticJSKineticJS is an HTML5 Canvas JavaScript framework that extends the 2d context by enabling canvas interactivity for desktop and mobile applications.
KineticJS is a fast, robust, HTML5 Canvas Library that is no longer maintained. The last stable version is v5.1.0, and it’s pretty darn solid. You can find the github project
MathJaxBeautiful math in all browsers.
A JavaScript display engine for mathematics that works in all browsers.
No more setup for readers. It just works.
MermaidGeneration of diagrams and flowcharts from text in a similar manner as markdown.
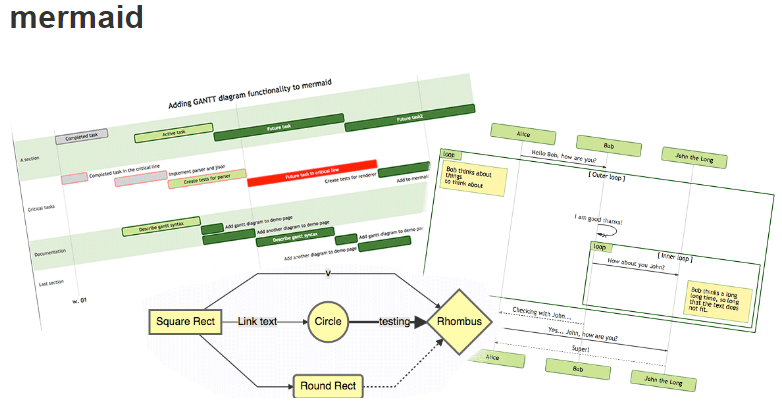
This is why mermaid was born, a simple markdown-like script language for generating charts from text via javascript.
NVD3NVD3 Re-usable charts for d3.js
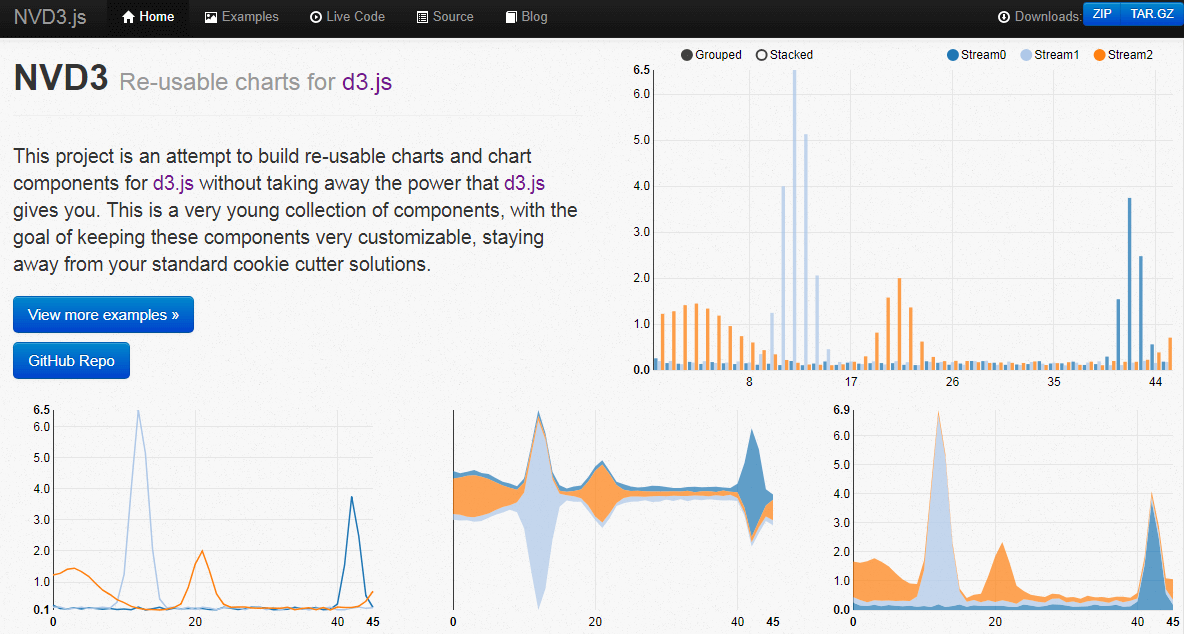
This project is an attempt to build re-usable charts and chart components for d3.js without taking away the power that d3.js gives you. This is a very young collection of components, with the goal of keeping these components very customizable, staying away from your standard cookie cutter solutions.
Paper.jsPaper.js — The Swiss Army Knife of Vector Graphics Scripting.
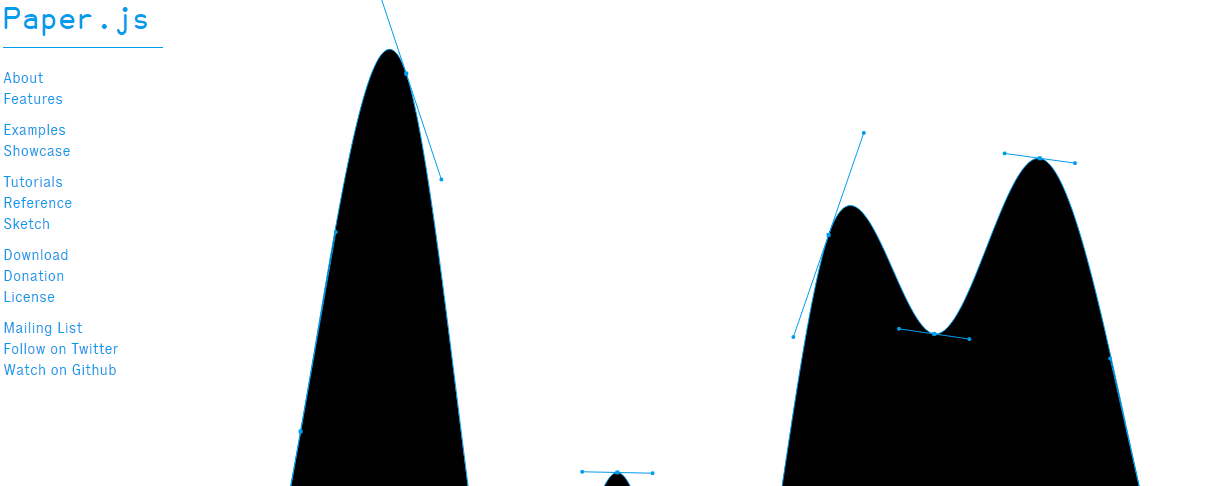
Paper.js is an open source vector graphics scripting framework that runs on top of the HTML5 Canvas. It offers a clean Scene Graph / Document Object Model and a lot of powerful functionality to create and work with vector graphics and bezier curves, all neatly wrapped up in a well designed, consistent and clean programming interface.
particles.jsA lightweight JavaScript library for creating particles.

A lightweight, dependency-free and responsive javascript plugin for particle backgrounds.
Paths.jsGenerate SVG paths for geometric shapes.
Paths.js is a library to generate SVG paths, allowing you to create your own charts using a functional and testable API. It provides the primitives to create various shapes and charts starting from raw data, but it does not prescribe how you render these charts. This means you can use Paths.js to build components for your favorite frontend framework, and works even server-side on NodeJS.
PlotlyThe open source JavaScript graphing library that powers Plotly.

Built on top of d3.js and stack.gl, plotly.js is a high-level, declarative charting library. plotly.js ships with 20 chart types, including 3D charts, statistical graphs, and SVG maps.
Protovisa graphical approach to visualization
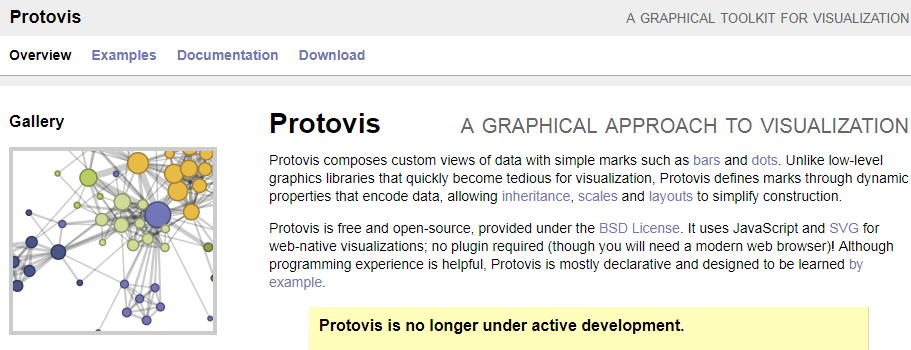
Protovis composes custom views of data with simple marks such as bars and dots. Unlike low-level graphics libraries that quickly become tedious for visualization, Protovis defines marks through dynamic properties that encode data, allowing inheritance, scales and layouts to simplify construction.
RaphaelRaphaël—JavaScript Library
Raphaël is a small JavaScript library that should simplify your work with vector graphics on the web. If you want to create your own specific chart or image crop and rotate widget, for example, you can achieve it simply and easily with this library.
shine.jsA library for pretty shadows.

Create a Shine.js instance for each DOM element you’d like to shine:
SupersizedFind Your Five Minute Culture
If I spent five minutes alone with a random person in your company, would I get the right impression?
three.jsJavaScript 3D library
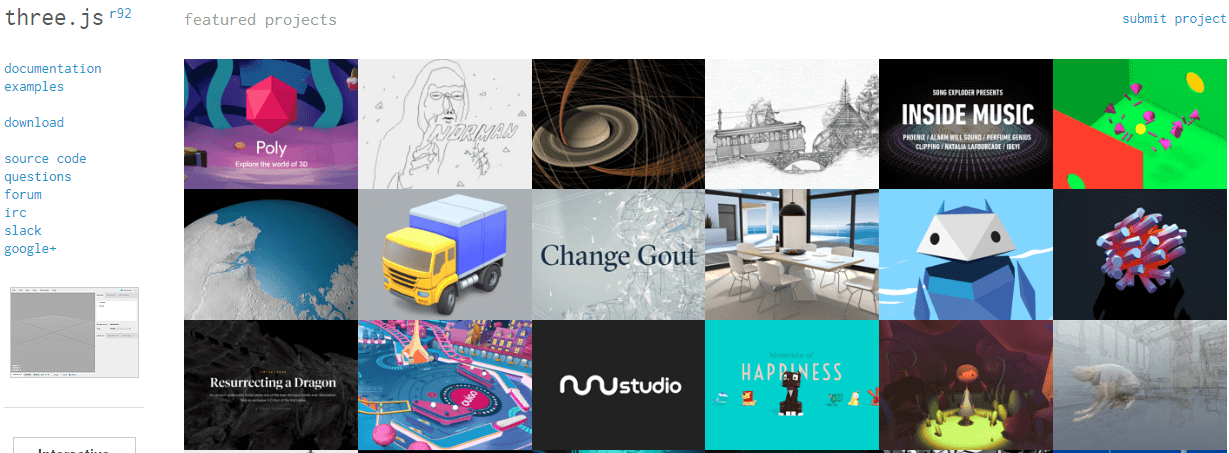
Three.js is a cross-browser JavaScript library and Application Programming Interface (API) used to create and display animated 3D computer graphics in a web browser. Three.js uses WebGL.
TimeplotWeb Widget for Plotting Time Series
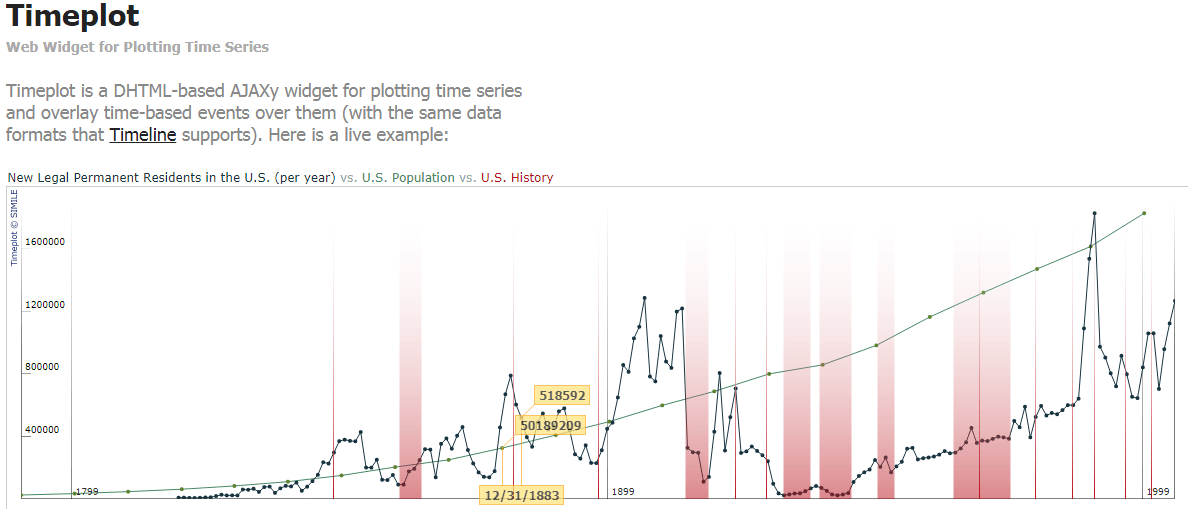
Timeplot is a DHTML-based AJAXy widget for plotting time series and overlay time-based events over them (with the same data formats that Timeline supports). Here is a live example:


